
Leading and Lagging Indicators – Key Results Deconstructed
Leading and lagging indicators are specific tools commonly used to assess the strength or weakness of economies or financial markets. Leading indicators change when an economic cycle or market trend occurs.
Lagging indicators are based on past events and provide insight into historical data for a particular market or economy. However, leading and lagging indicators can also be used in other economic sectors, for example, to set company targets using the OKR method.
These indicators relate to key results and initiatives. Initiatives are tasks (outputs, things we control) that need to be done to achieve OKRs (things we do not control but want to influence with said tasks). Not all initiatives need to contribute to OKRs, but make sure you take on all the initiatives you need, to achieve your OKRs.
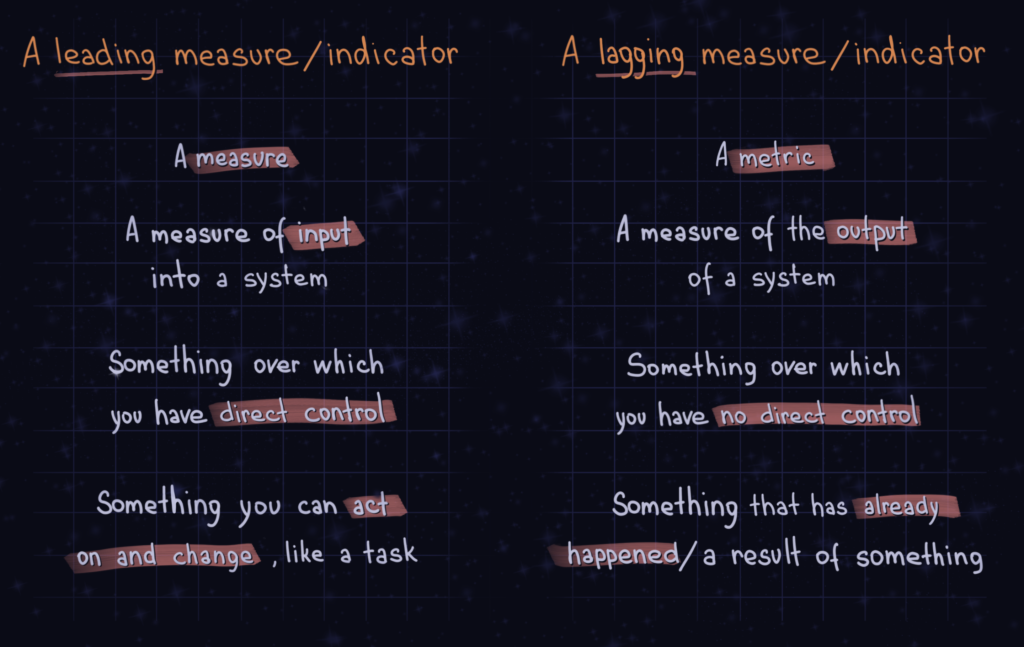
A leading indicator looks ahead to future outcomes and events. A lagging indicator looks back to see if the intended outcome was achieved.
Leading and lagging indicators explained
Think of it as a simple equation where action = result. Start with the desired results (lagging indicators) and then work backwards to identify the necessary actions (leading indicators) to achieve those results
For example, sales are a lagging indicator of business performance. To generate revenue, and revenue growth, we need to influence the leading indicators of revenue generation.
Lagging indicator: Sales revenue
Leading Indicators: Customers, Leads, Visitors, Marketing
In other words, leading indicators provide what are called predictive signals (making predictions about something that will happen before those events or trends occur). Lagging indicators produce signals based on a trend that is already taking place.
Assumed predictors of future success
Typically, it’s more difficult to define leading indicators. In business, examples of leading indicators might be consumer confidence or customer satisfaction. If you have greater customer satisfaction, that can help you predict future sales. Satisfied customers tend to be repeat customers and are more likely to recommend your business to others.
If your leading indicators aren’t aligned the way you need them to be, meaning you’re not on track to meet your goals, you can always make adjustments to the strategy.
This is one of the biggest challenges of identifying leading indicators: balancing certainty about enterprise-level indicators with responsiveness to team actions.
Leading indicators are predictors of future success because the change in metrics can be measured continuously, and it can be said, without a doubt, that focusing on them influences the company’s higher-level indicators. Leading indicators can be quickly identified and influence day-to-day decisions. This is because these metrics change as a direct result of a team’s contribution.
This allows for proactivity in a company. The company can use leading indicators to determine what activities need to be undertaken to positively impact the organization. Leading indicators are therefore the right way to boost the business you will need in the future. For example, qualified leads are a leading indicator of future sales.
Looking back to identify existing trends
Lagging indicators are an important element in your performance management framework because they represent the undeniable truth. Unlike leading indicators, however, there is nothing you can do to change the results. Lagging indicators are, by definition, final when you review them.
They are easy to spot because companies have numerous reports that show some of the key metrics.
In some cases, companies focus too much on lagging indicators and miss important opportunities to impact results by adjusting measures that impact their leading indicators.
Unlike leading indicators, lagging indicators are used to identify existing trends that may not be apparent at first glance. Lagging indicators also correspond to KPIs. An example of a lagging measure, and thus KPI, is increasing market share by 10%.
In short, there are key characteristics of leading and lagging indicators:
How to implement lagging and leading indicators in the OKR method
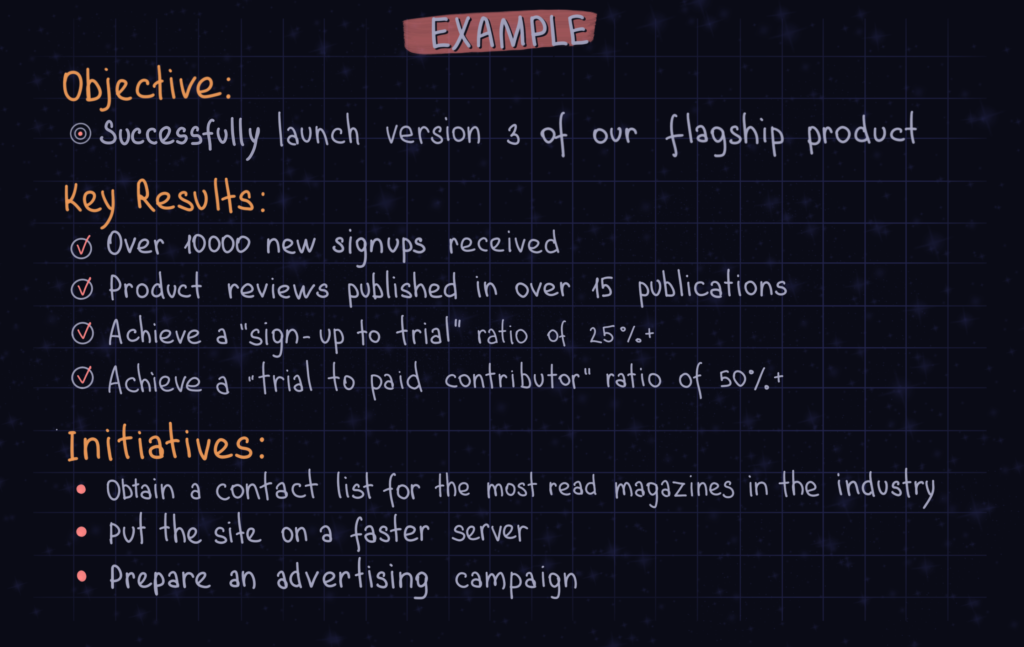
When using these indicators in the OKR method, some general assumptions can be made. An objective is an outcome – the state that you want to achieve.
Lagging indicators are the classic type of indicators used to describe Key Results. Leading indicators are also often used to identify initiatives that will contribute to the KR achievements of the leading indicators.
However, we can also use leading indicators to successfully define KRs as long as we follow two golden rules:
1) Make sure that the leading indicators influence the expected objective/lagging key result;
2) Make sure we do not control its achievement.
Let’s imagine that we have an objective: “Rock US sales”.
For the US market, we have a target KPI of 100 sales units for the quarter. A classic KR would be “100 unit sales” – which is a lagging indicator. What problem does this create?
Sales can take time. By the time we realize that the actual numbers don’t match our expectations, it’s too late to take another action (i.e. lagging information).
A classic example of a poor alternative Key Result with a leading indicator is:
“Send 2000 marketing emails”.
Why? First, a basic understanding of email marketing would lead to the assumption that the more emails we send, the greater our sales volume will be. Of course, this result depends on HOW we send said emails (subject, body, target audiences, time of sending, etc.). Secondly, sending 2000 emails is something we can CONTROL. So it cannot be a Key Result (as it violates the second golden rule).
Finally, a good alternative of the Key Result with a leading indicator would be for the same problem: “Receive 1000 responses to marketing emails”.
To achieve that we would probably also need to send 2000+ marketing emails. But with this approach, we need to send those emails effectively. How effectively? Effectively enough to get responses from 1000 potential customers. When that happens, the prospects show interest and it becomes likely that we would convert, for example, 10%+ of them. Consequently, our target KPI will be achieved.
An example of the exercise of turning output key results into more outcome-related ones is to ask “Why?”
“Do Competitor Research!” – WHY?
“Create more content ideas.” – WHY?
“Increase the engagement of our email sign-ups.” – WHY?
Once you’ve selected an indicator, you need to understand the main problem your customers, colleagues, or stakeholders will face when you take that action. This is the problem area that will inform the type of solutions you want to validate and build – using your chosen leading indicators to measure the success of your work.
Leading and lagging indicators: A work in progress
Working with leading and lagging indicators is always going to be a work in progress. Internal and external factors will change continuously, so they need to be monitored on an ongoing basis.
It’s important to identify measurable key results so you can check the progress you’re making to reach your objective. When used effectively, it allows you to plan better, make optimal decisions faster, merge and motivate your team, and better understand your company.
Takeaways:
- A leading indicator looks forward to future outcomes.
- A lagging indicator looks back to see if the intended outcome was achieved.
- Main outcome = lagging indicators only/ Initiative = leading indicator only.
- A leading indicator is something you have direct influence over, while a lagging indicator is something you don’t have direct influence over.